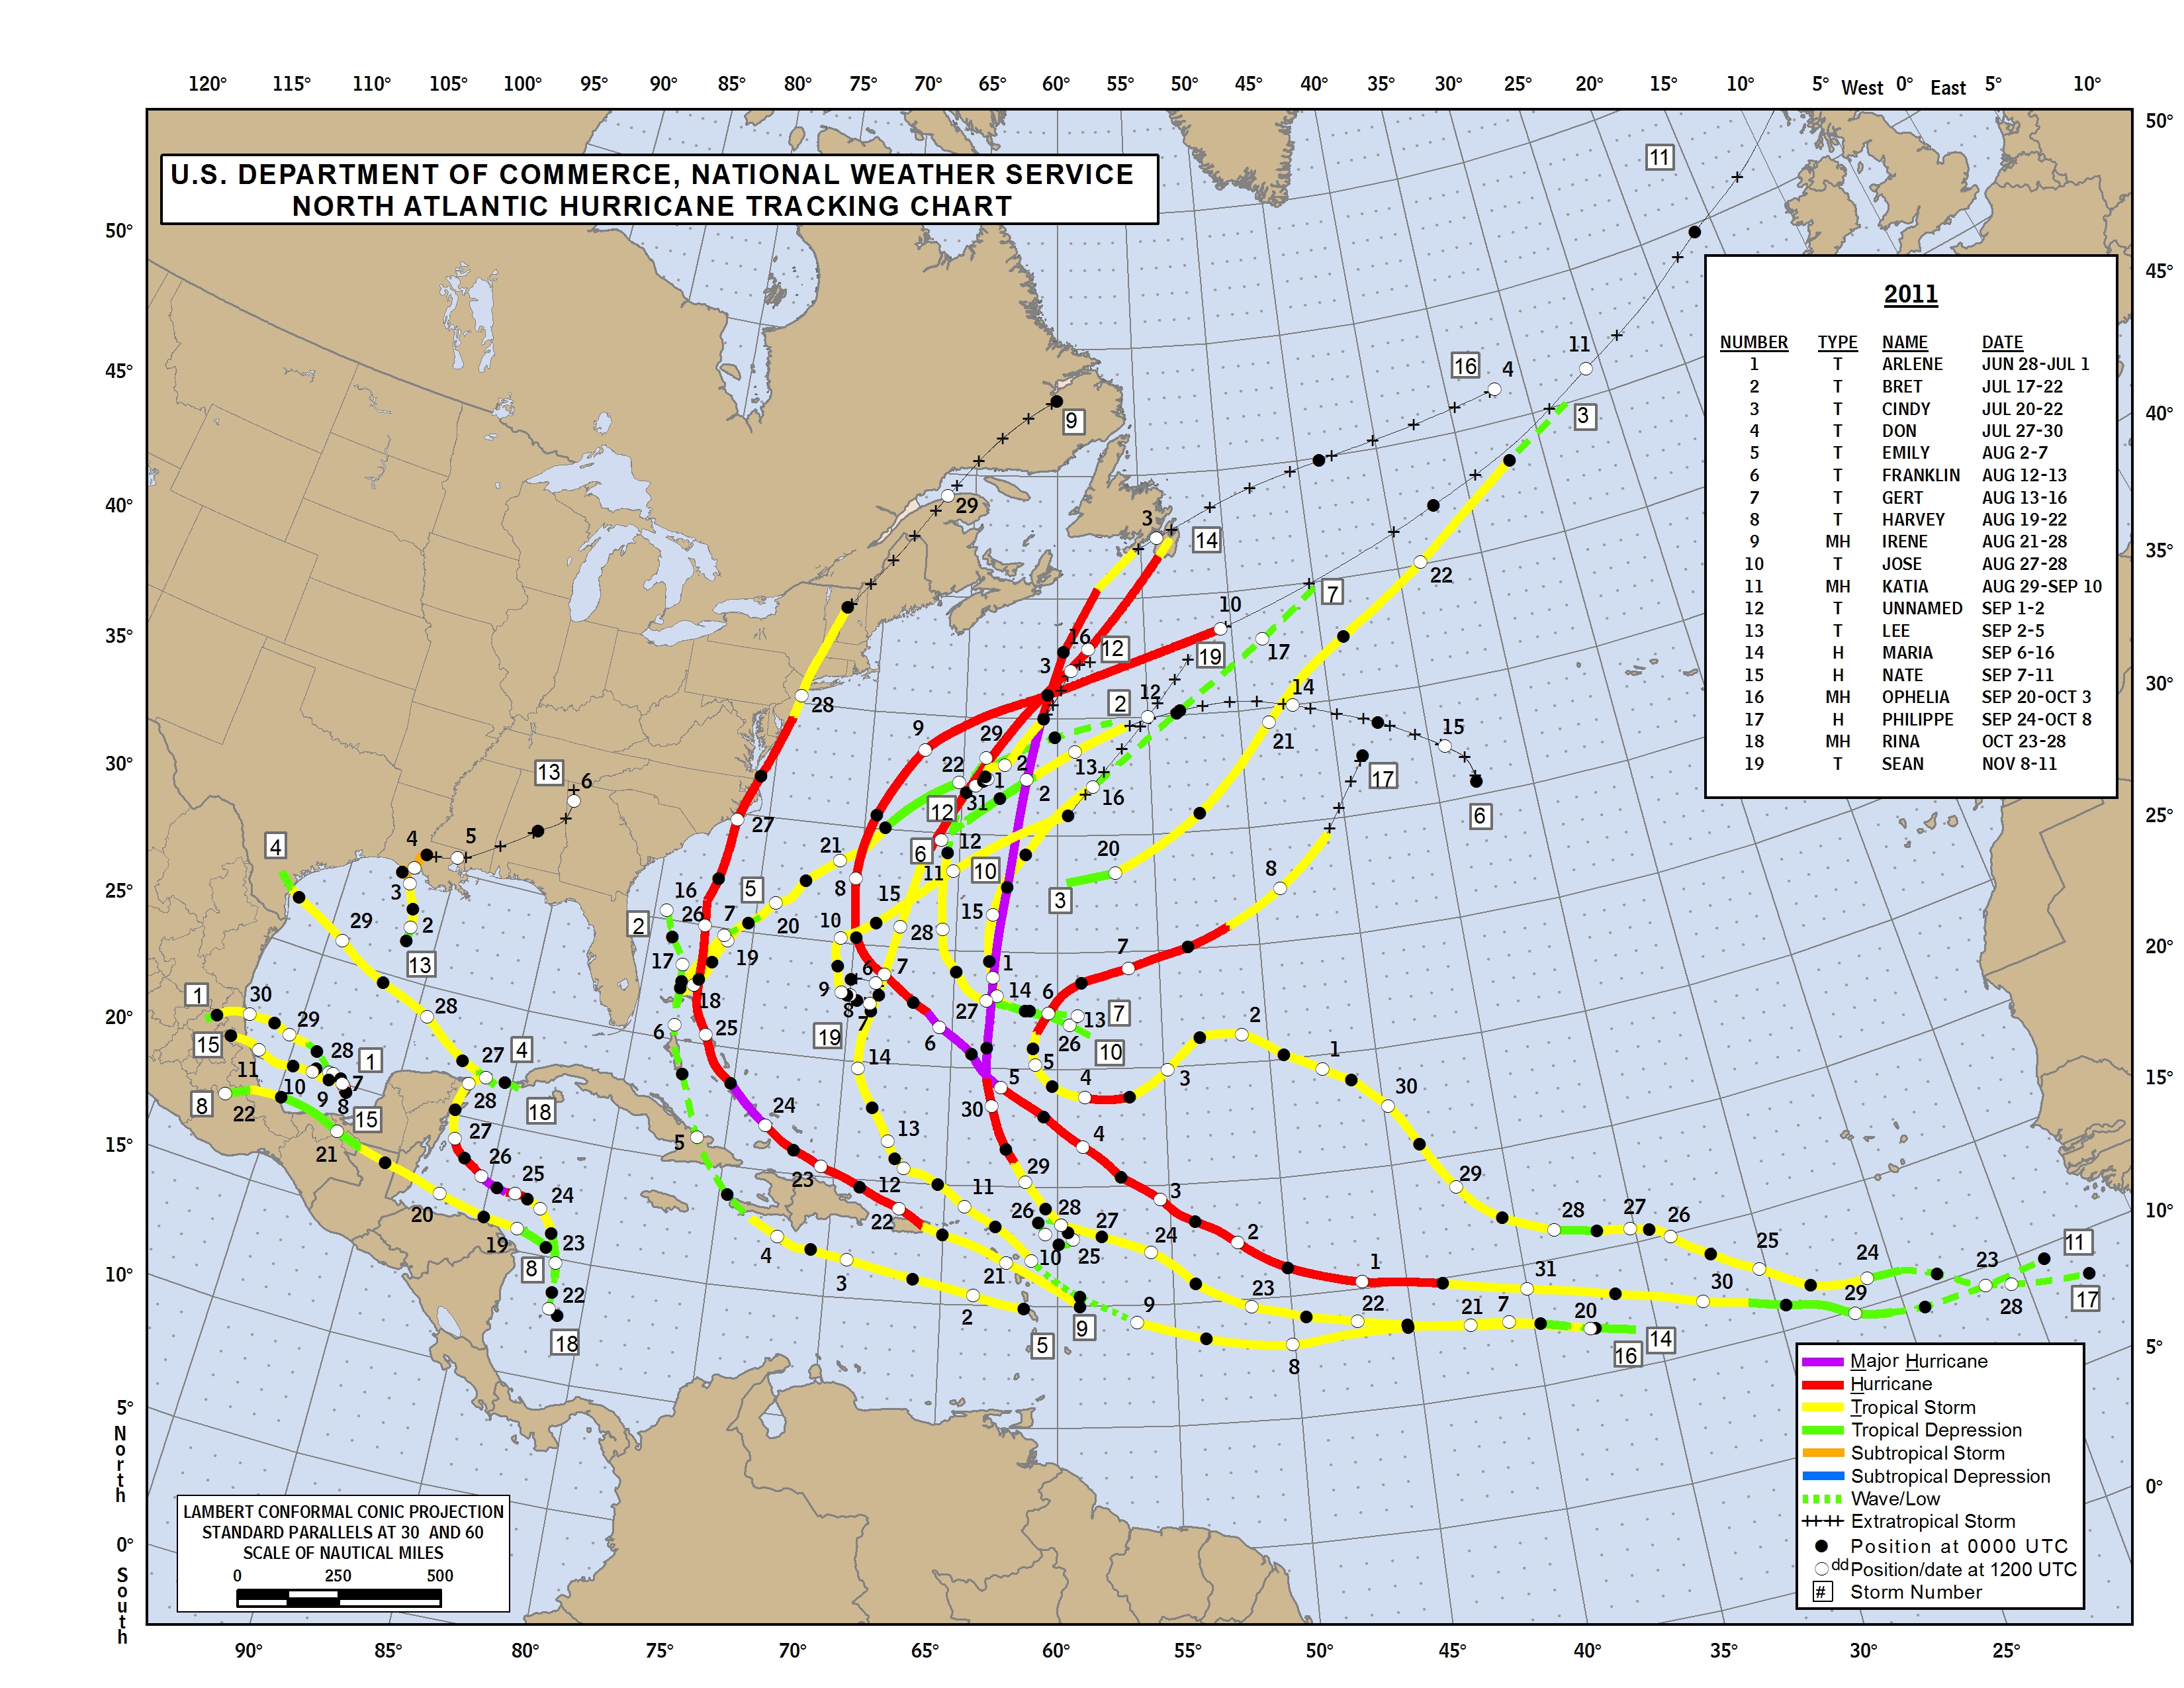
We have been working on a case study for Hurricane Irene and a part of our case study will be examining the wind, wind gusts, and gust factors for the storm. Recall that Irene made landfall near Cape Lookout NC at 8:00 am EDT on 27 August with maximum sustained winds near 85 mph. Irene tracked north northeast over eastern NC/VA before re-emerging in the Atlantic near the southern end of the Chesapeake Bay at around 6:00 pm EDT on 27 August. The track of Irene is shown in the 2011 North Atlantic tracking chart.

Map of the 39 METAR locations in VA, NC, and SC used in the wind and wind gust analysis for Hurricane Irene
NC State student volunteers Rebecca Duell and Lindsey Anderson completed a great deal of the data retrieval and chart creation that will be used in the case study and shown below. The students created charts containing sustained winds, wind gusts, peak winds, and gust factors for 39 METAR locations in VA, NC, and SC. The locations examined are shown in the figure to the right as stations with a yellow box around the station ID and the individual plots of sustained winds, wind gusts, hourly peak winds, and gusts factor for each of these stations is shown in the table of links further below.
The chart below shows the sustained winds versus gust factors for the 39 stations examined. Note that these values are taken from the standard hourly observation at each location, and not the hourly peak wind gust. It should be noted that this summary chart includes all of the stations with varied locations, exposure, wind trajectory, etc. In examining the winds and gusts factors for Irene, several items can be noted.
1) The minimum gust factor observed was generally 1.2 with only 10 out of a possible 1055 observations accompanied by a gust factor of less than 1.2 and just 27 occurrences had gust factors less than 1.25.
2) The gust factor generally decreases and converges with increasing sustained wind speed
3) There is a large variation in gust factors. For lighter sustained winds of 20 MPH or less, gust factors varied greatly from 1.2 to 2.75.
4) At more moderate sustained winds of 20 to 30 MPH, gusts factors ranged from 1.2 to 2.0
5) At stronger winds of 30 MPH or greater, the gust factors were more consistent, ranging from 1.2 to 1.7
6) A one size fits all gust factor did not apply during Irene

Chart of sustained winds versus gust factors for the 39 stations examined during Hurricane Irene
In general, the chart above demonstrates an inverse relationship between the wind speed and gust factor. There are several reasons for this including the reduced frequency of stronger winds, the tendency of the stronger winds to be located near the coast with on-shore exposure or reduced surface roughness, and reduced mixing near the core of the storm.
Individual plots of sustained winds, wind gusts, hourly peak winds, and gusts factor are available via the links below.
KAKQ | KASJ | KCHS | KCPK | KCRE | KECG | KEDE | KEWN | KFAY | KFKN | KGGE | KGSB | KHNZ | KHSE | KILM | KISO | KJNX | KLBT | KLFI | KLHZ | KMEB | KMQI | KMRH | KMYR | KNCA | KNGU | KNKT | KNTU | KOAJ | KONX | KORF | KPGV | KPHF | KPTB | KRDU | KRIC | KRWI | KSFQ | KSUT | KTTA
A histogram of the frequency of gust factors during Irene is shown below. Note the very few occasion of gust factors of less than 1.2 with a large fraction (53%) of gusts factors occurring in the 1.3 to 1.6 range and 76% of gust factors occurring in the 1.3 to 1.8 range. The average gust factor among the 1055 observations was 1.60 with a median value of 1.54.

Histogram of the frequency of gust factors observed during Hurricane Irene
Several studies have examined the gust factor while exploring important local influences such as surface roughness and exposure while considering the influence of time averaging periods. One study from Harper et al. (2008) noted the different gust factors for the peak 3 second gust occurring within a one minute period for various exposures:
In-Land (roughly open terrain) 1.49
Off-Land (offshore winds at a coastline) 1.36
Off-Sea (onshore winds at a coastline) 1.23
At-Sea (offshore > 20km) 1.11
Harper, B. A., J. D. Kepert, and J. D. Ginger, 2008: Wind speed time averaging conversions for tropical cyclone conditions. Proc. 28th Conf.Hurricanes and TropicalMeteorology,Orlando, FL,Amer. Meteor. Soc., 4B.1. [Available online at http://ams.confex.com/ams/28Hurricanes/techprogram/paper_138064.htm]
